
Day 3: Metrics & APM!
Day 3 is probably our biggest day this week!
Checkout our launch video or keep reading!
Today we’re launching the beginning of our new metrics product! This will allow you to query all of your Highlight data on a single pane of glass, enabling features around product analytics, performance metrics and more!
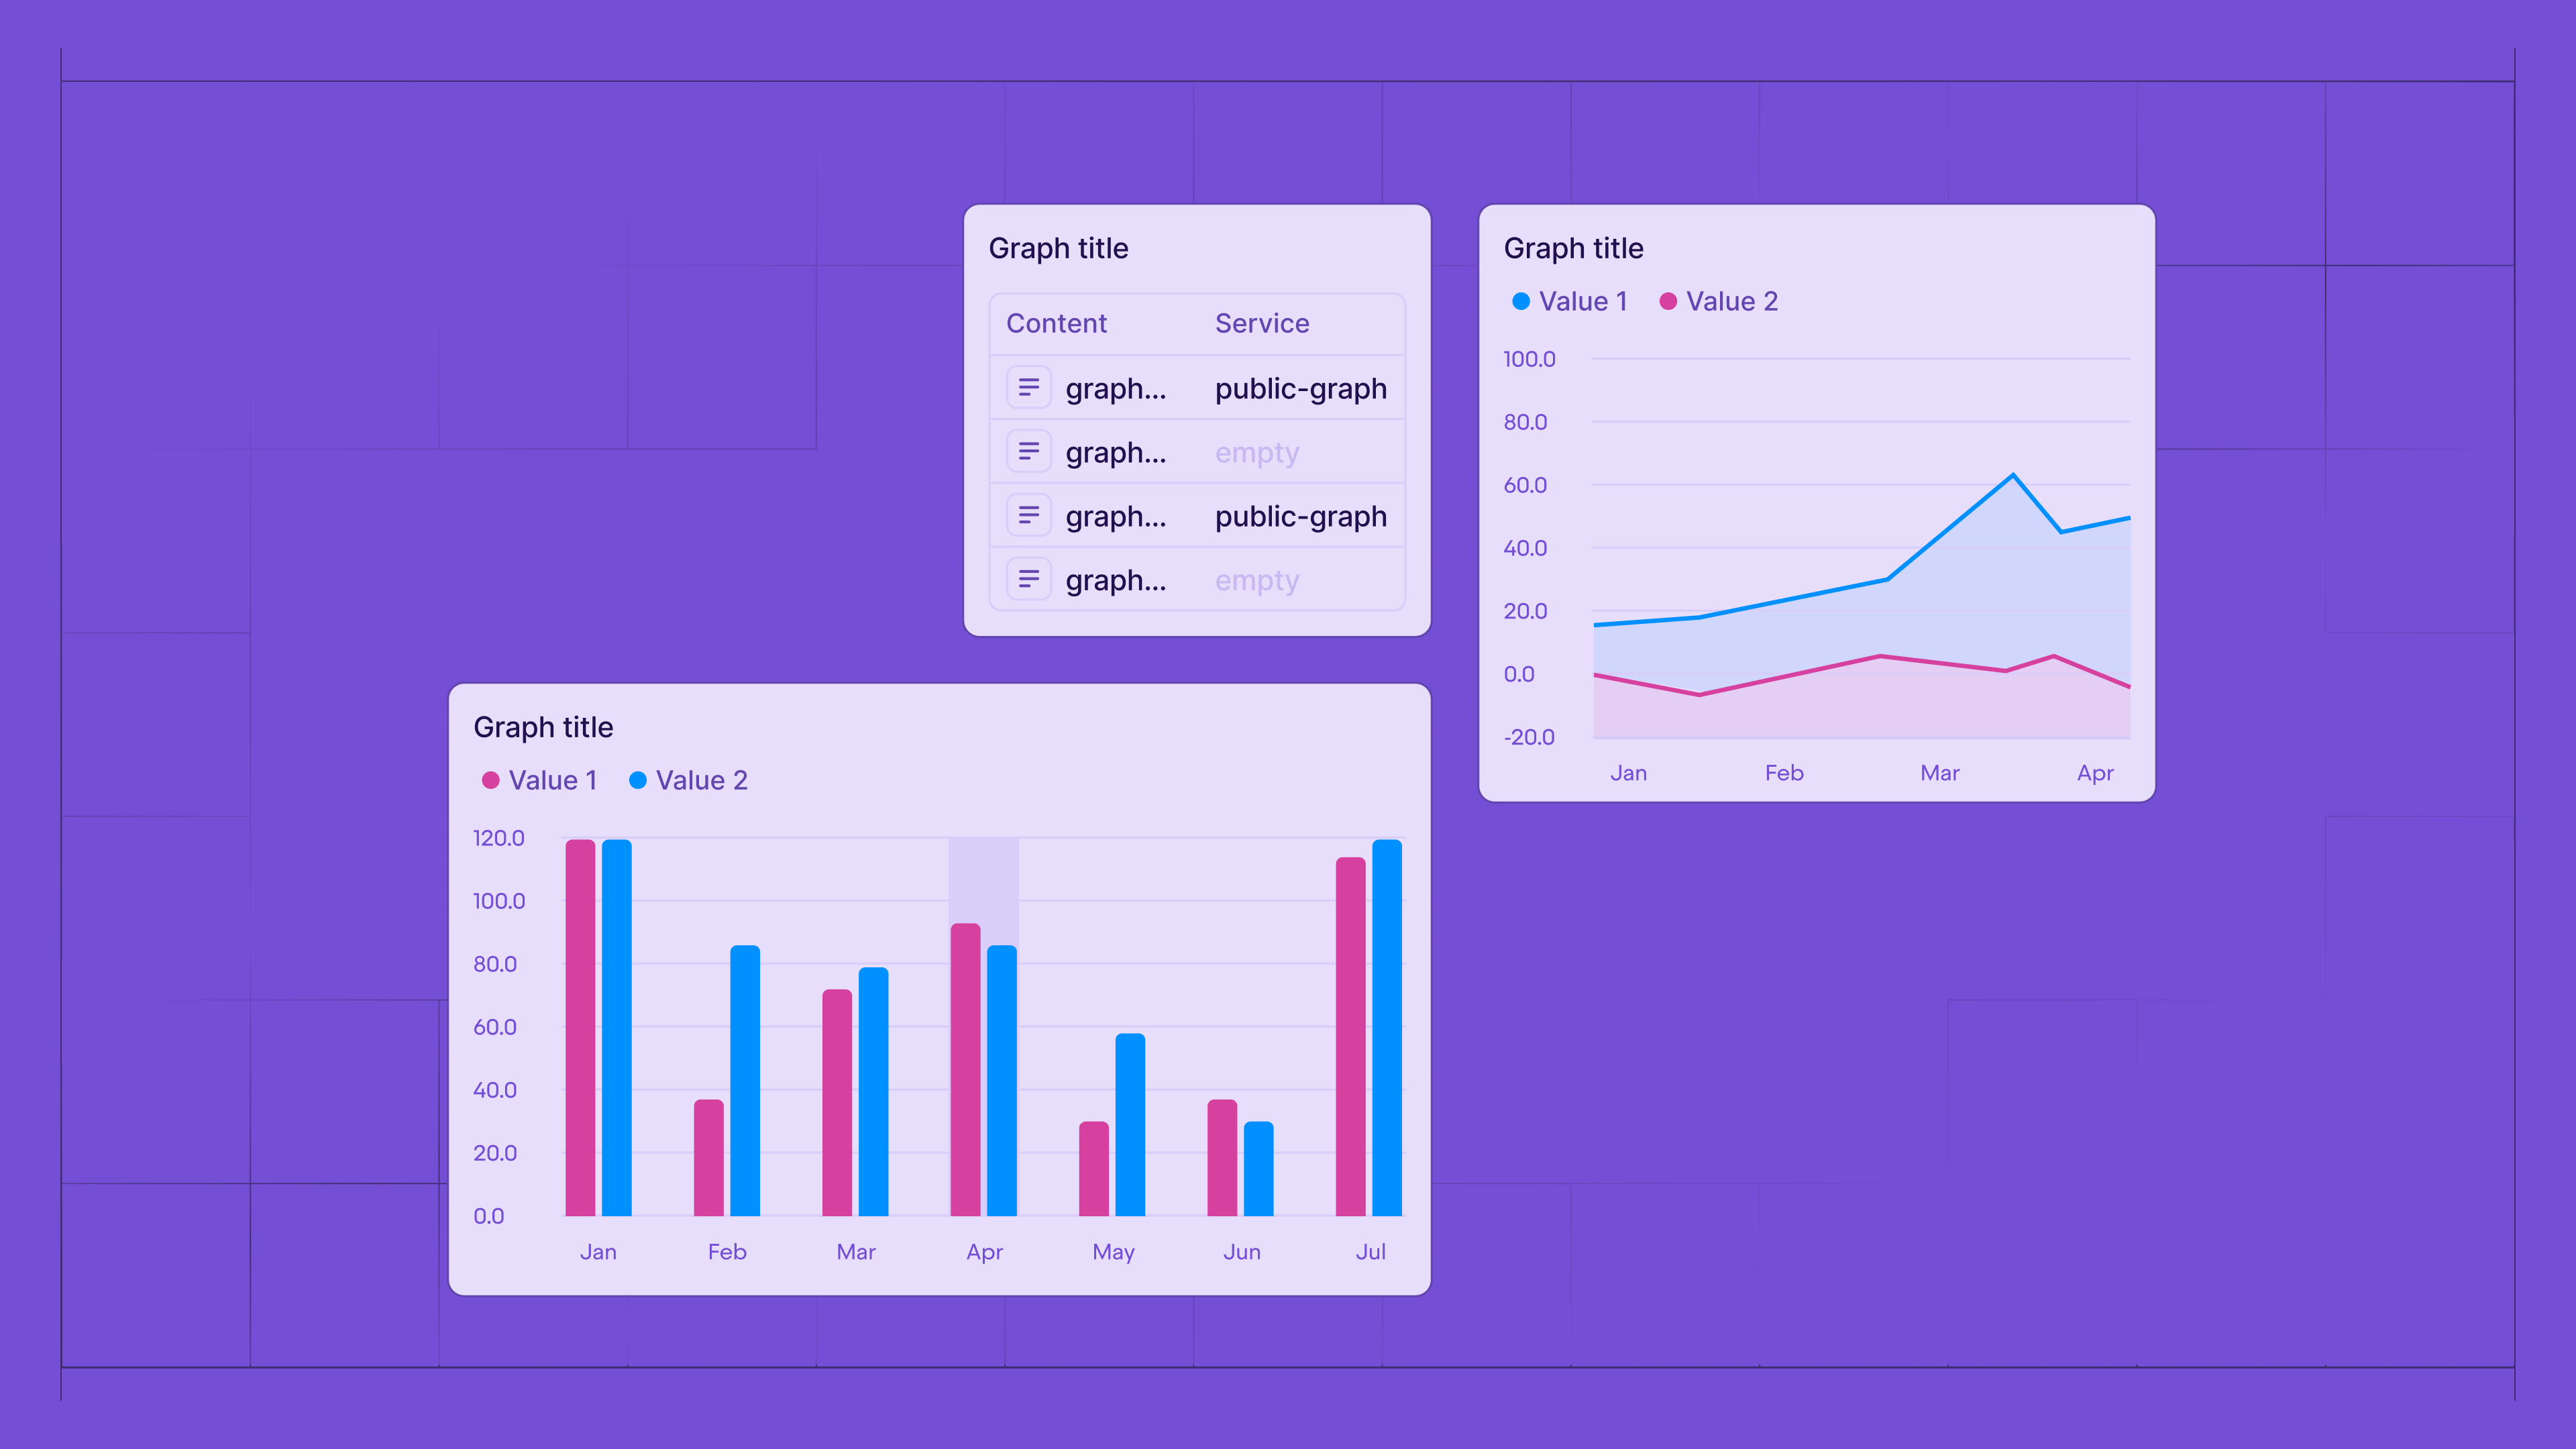
The new metrics product will be available for all users. To get started, head over to the “Metrics” tab in the Highlight dashboard here, and click on the first dashboard that you see. This dashboard will have several default visualizations that you can use to look at product usage data and performance metrics.
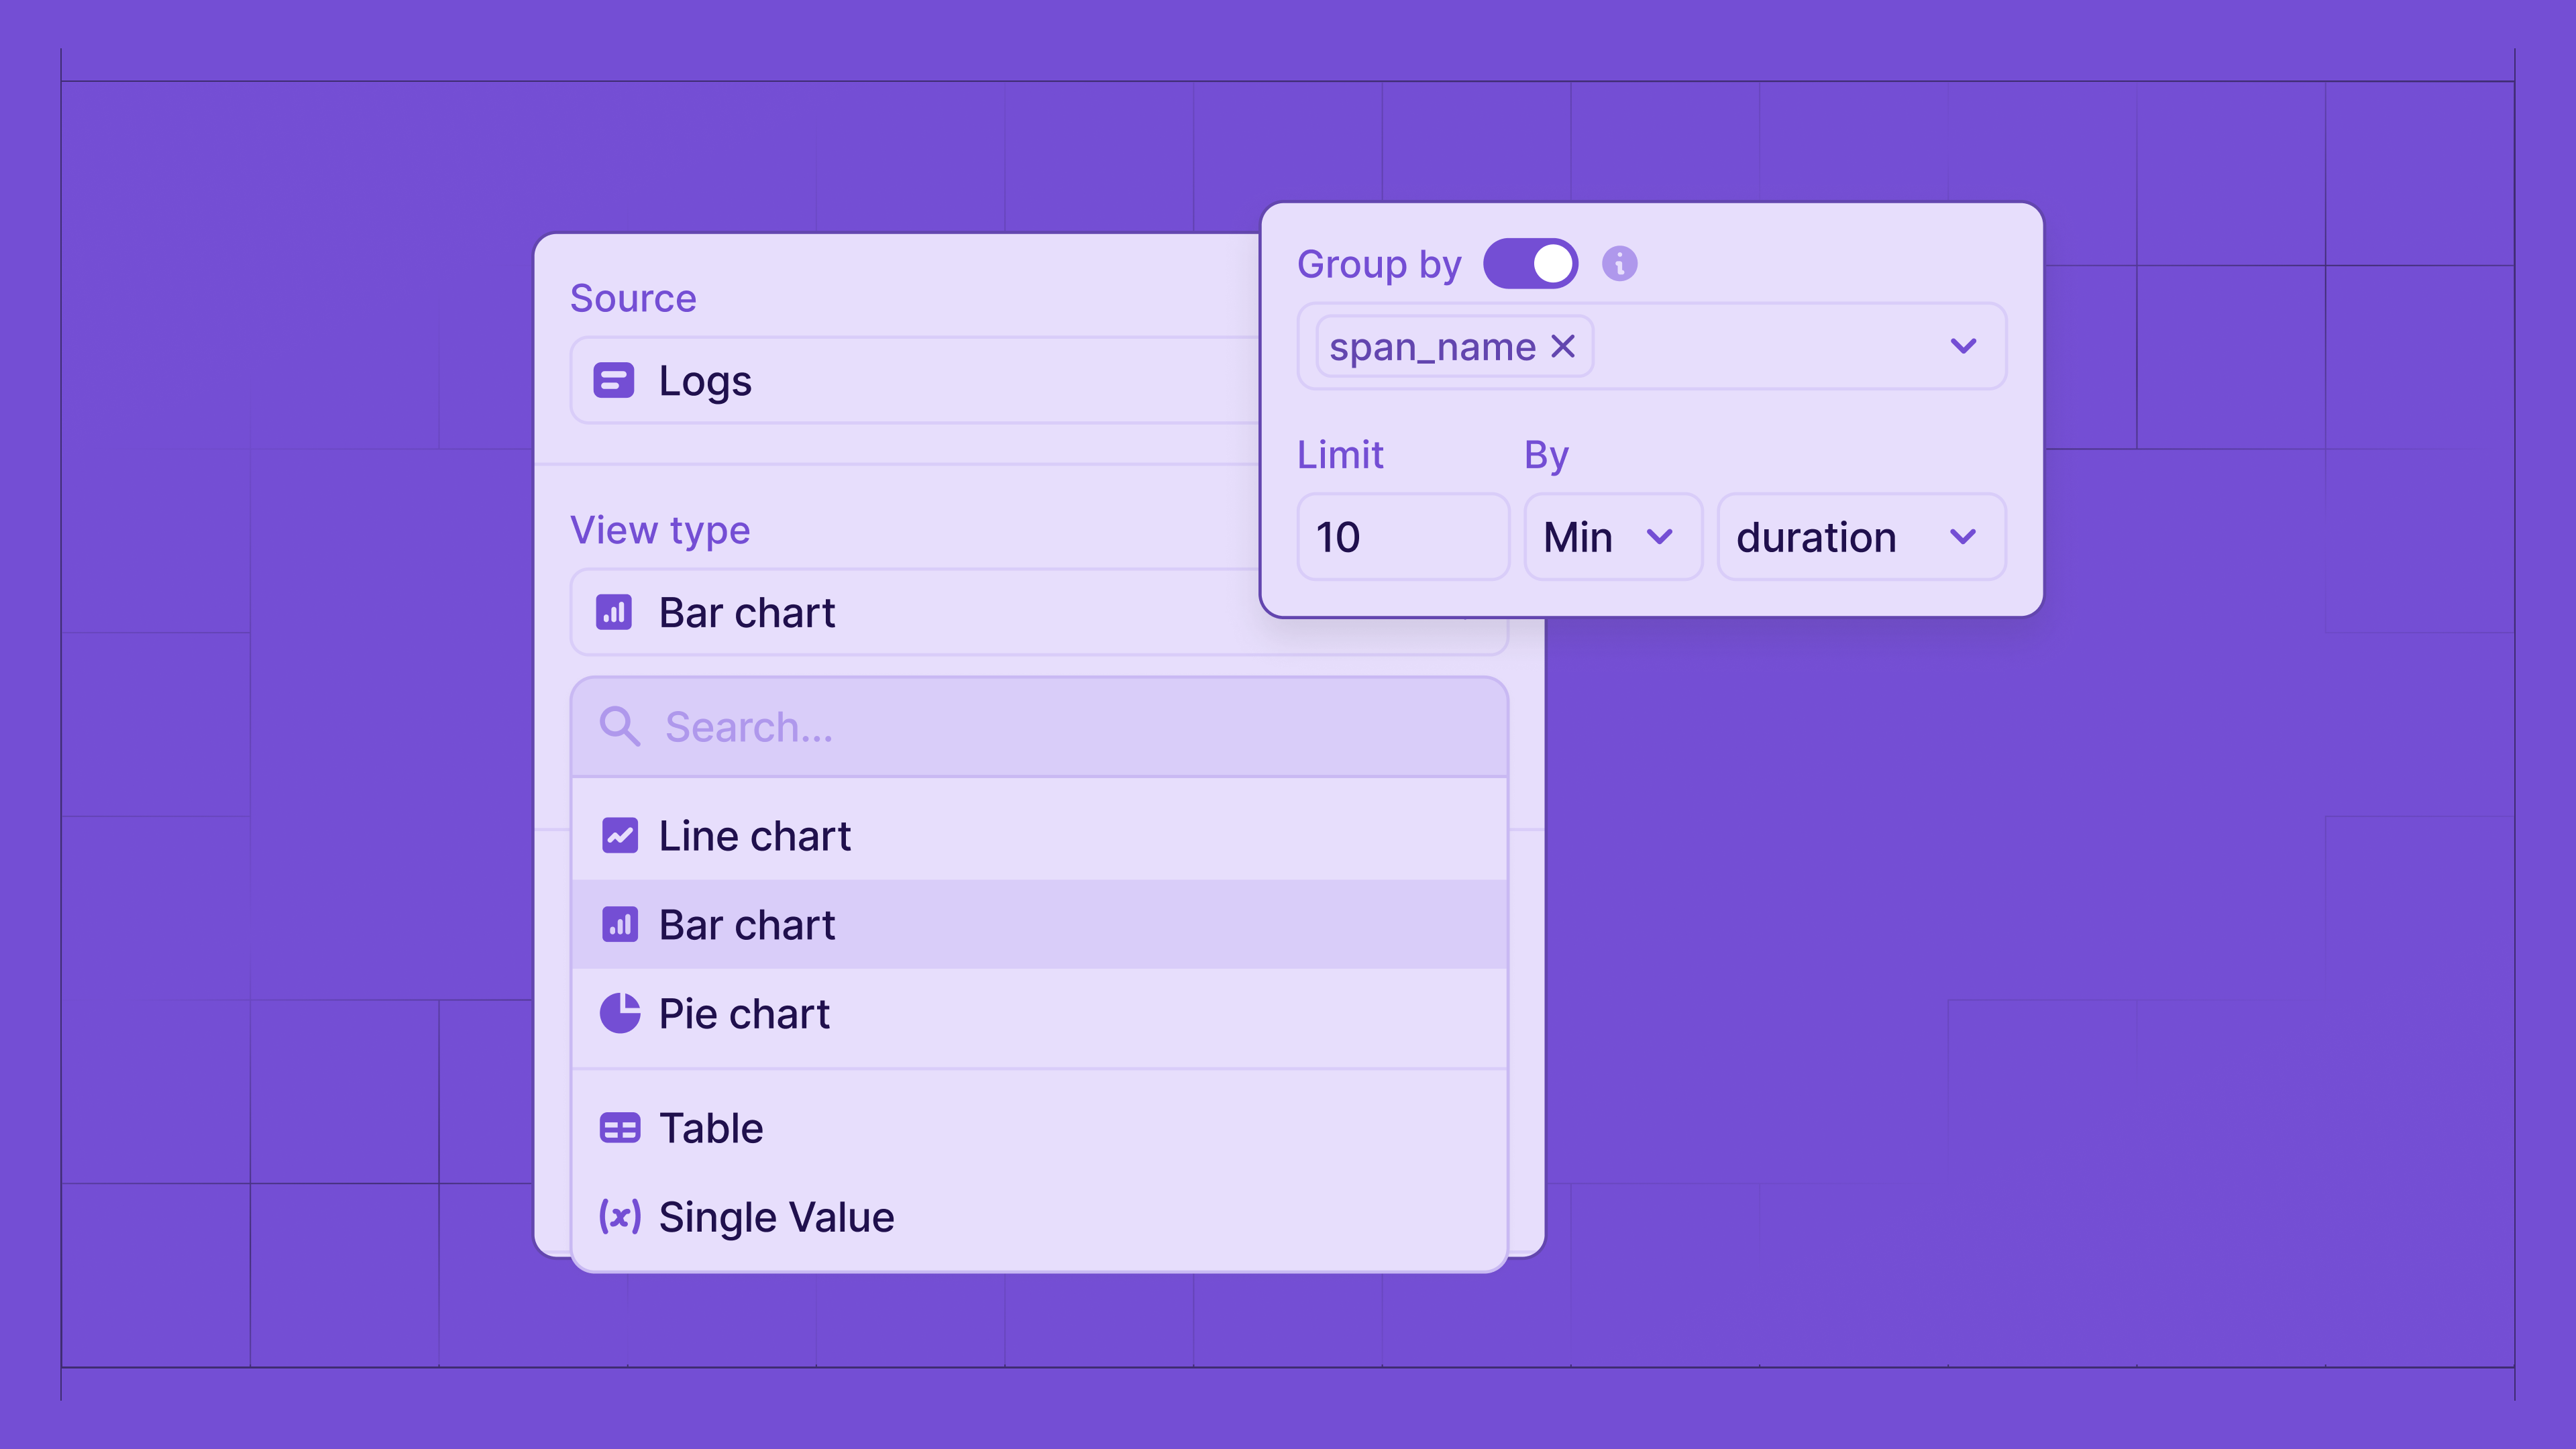
Once you click “edit” in one of these graphs or decide to create your own, you’ll also have the ability to customize the visualizations with parameters including the product (sessions, errors, logs, etc..) the function to group by, and more!
Have feedback for us on the metrics product? If you have any questions or want to share some feedback, head to our our discord!
Other articles you may like
Feb 9, 2024 • 11 min. read