Using highlight.io with Python on AWS Lambda
Learn how to set up highlight.io on AWS Lambda.
Configure client-side Highlight. (optional)
If you're using Highlight on the frontend for your application, make sure you've initialized it correctly and followed the fullstack mapping guide.
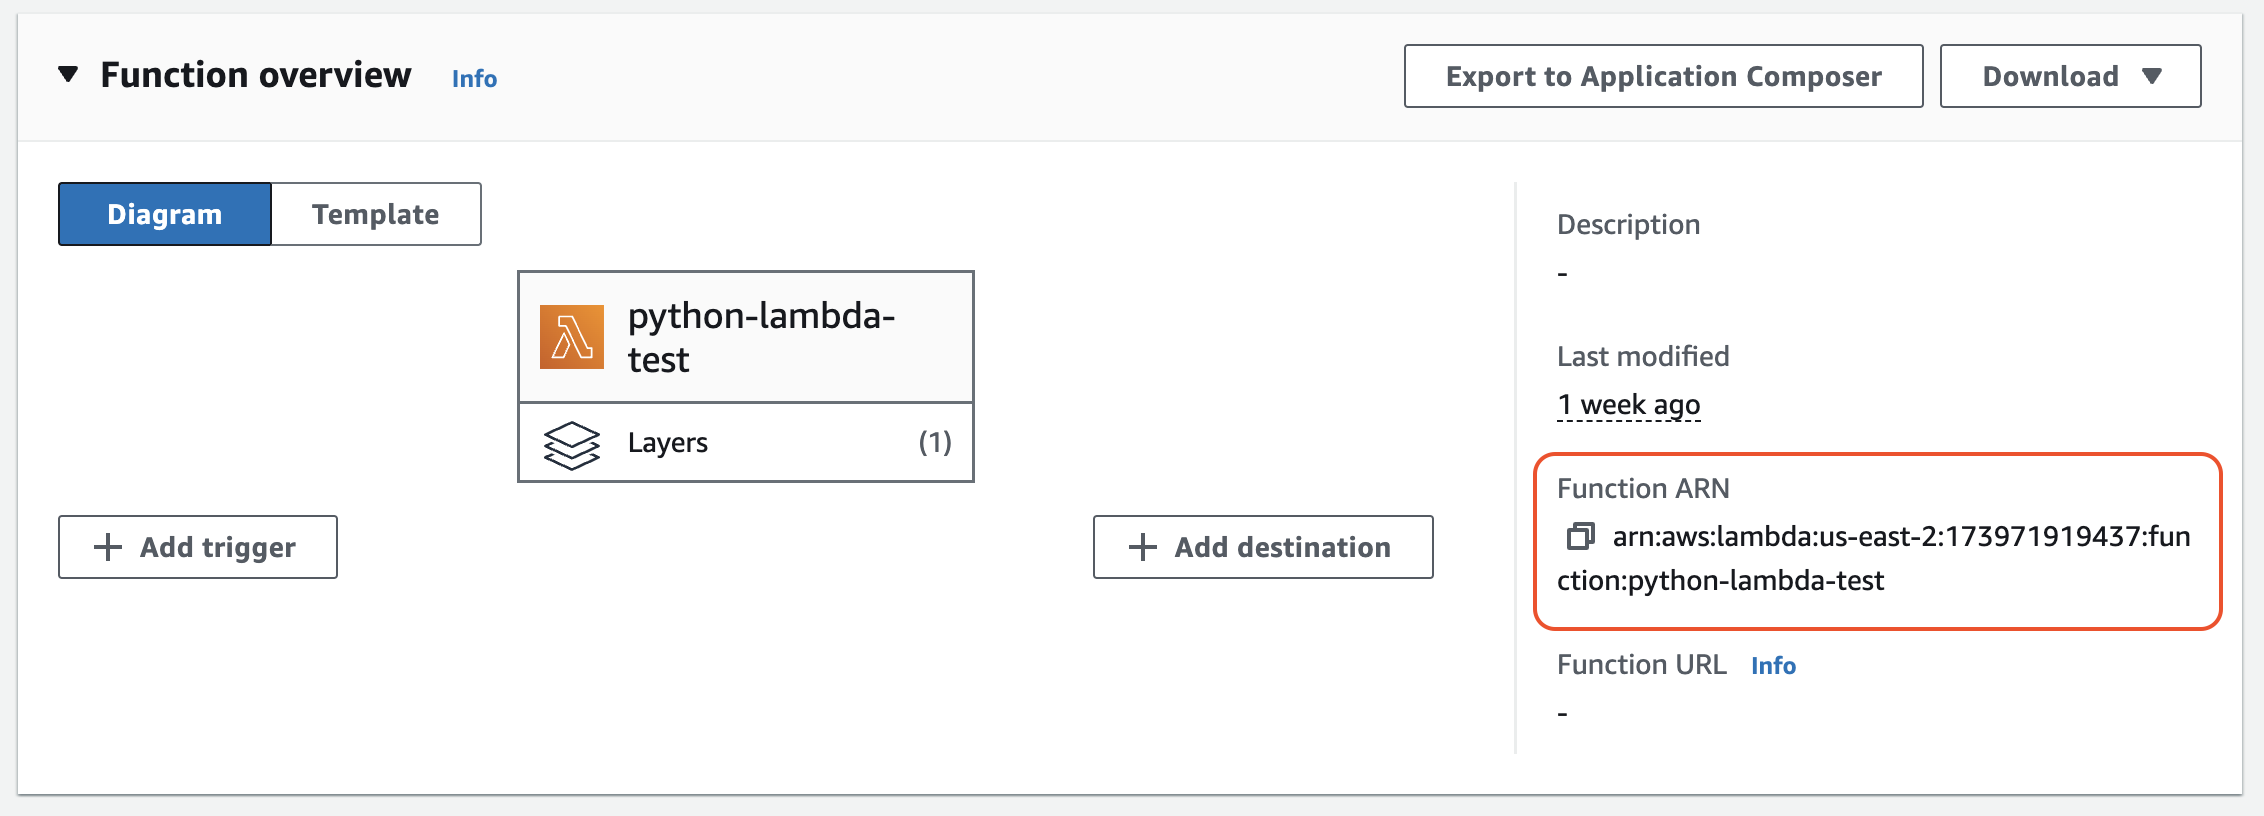
Add the ARN layer.
Add the ARN layer to your Lambda function. Click on the "Layers" tab in the Lambda console and click "Add layer". You can find the most recent instrumentation release URLs in their releases.

arn:aws:lambda:<region>:184161586896:layer:opentelemetry-<language>-<version>Set the ENV vars.
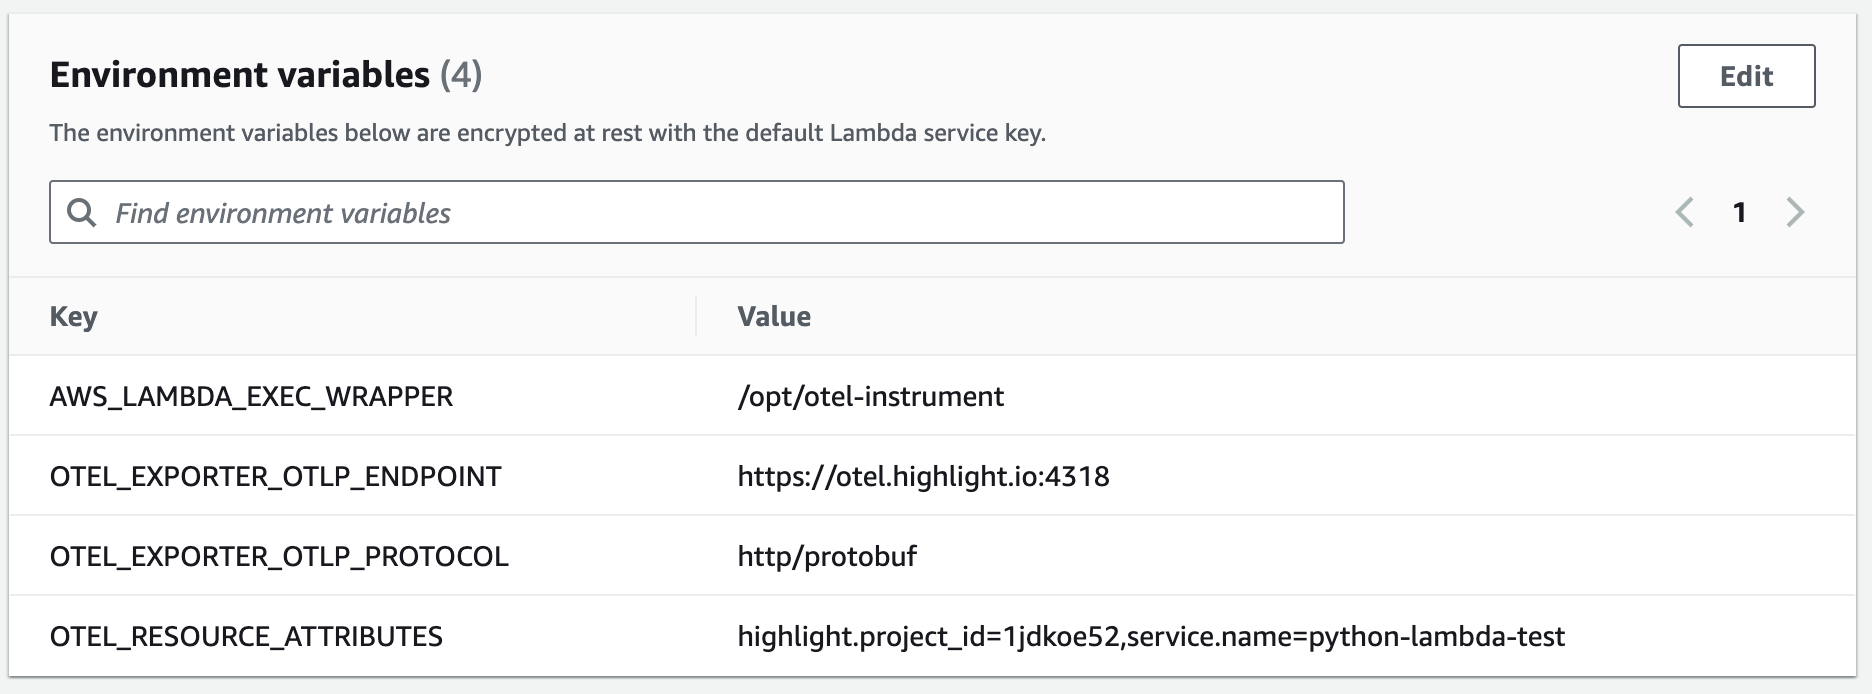
Set the ENV vars to connect your Lambda to Highlight. For more details on setting up the OTeL Lambda autoinstrumentation and some language-specific details, see their documentation.

AWS_LAMBDA_EXEC_WRAPPER=/opt/otel-instrument
OTEL_EXPORTER_OTLP_ENDPOINT=https://otel.highlight.io:4318
OTEL_RESOURCE_ATTRIBUTES=highlight.project_id=<project_id>,service.name=<service_name>Test your Lambda function.
Hit your Lambda function by testing it from the AWS console or sending an HTTP request to it.
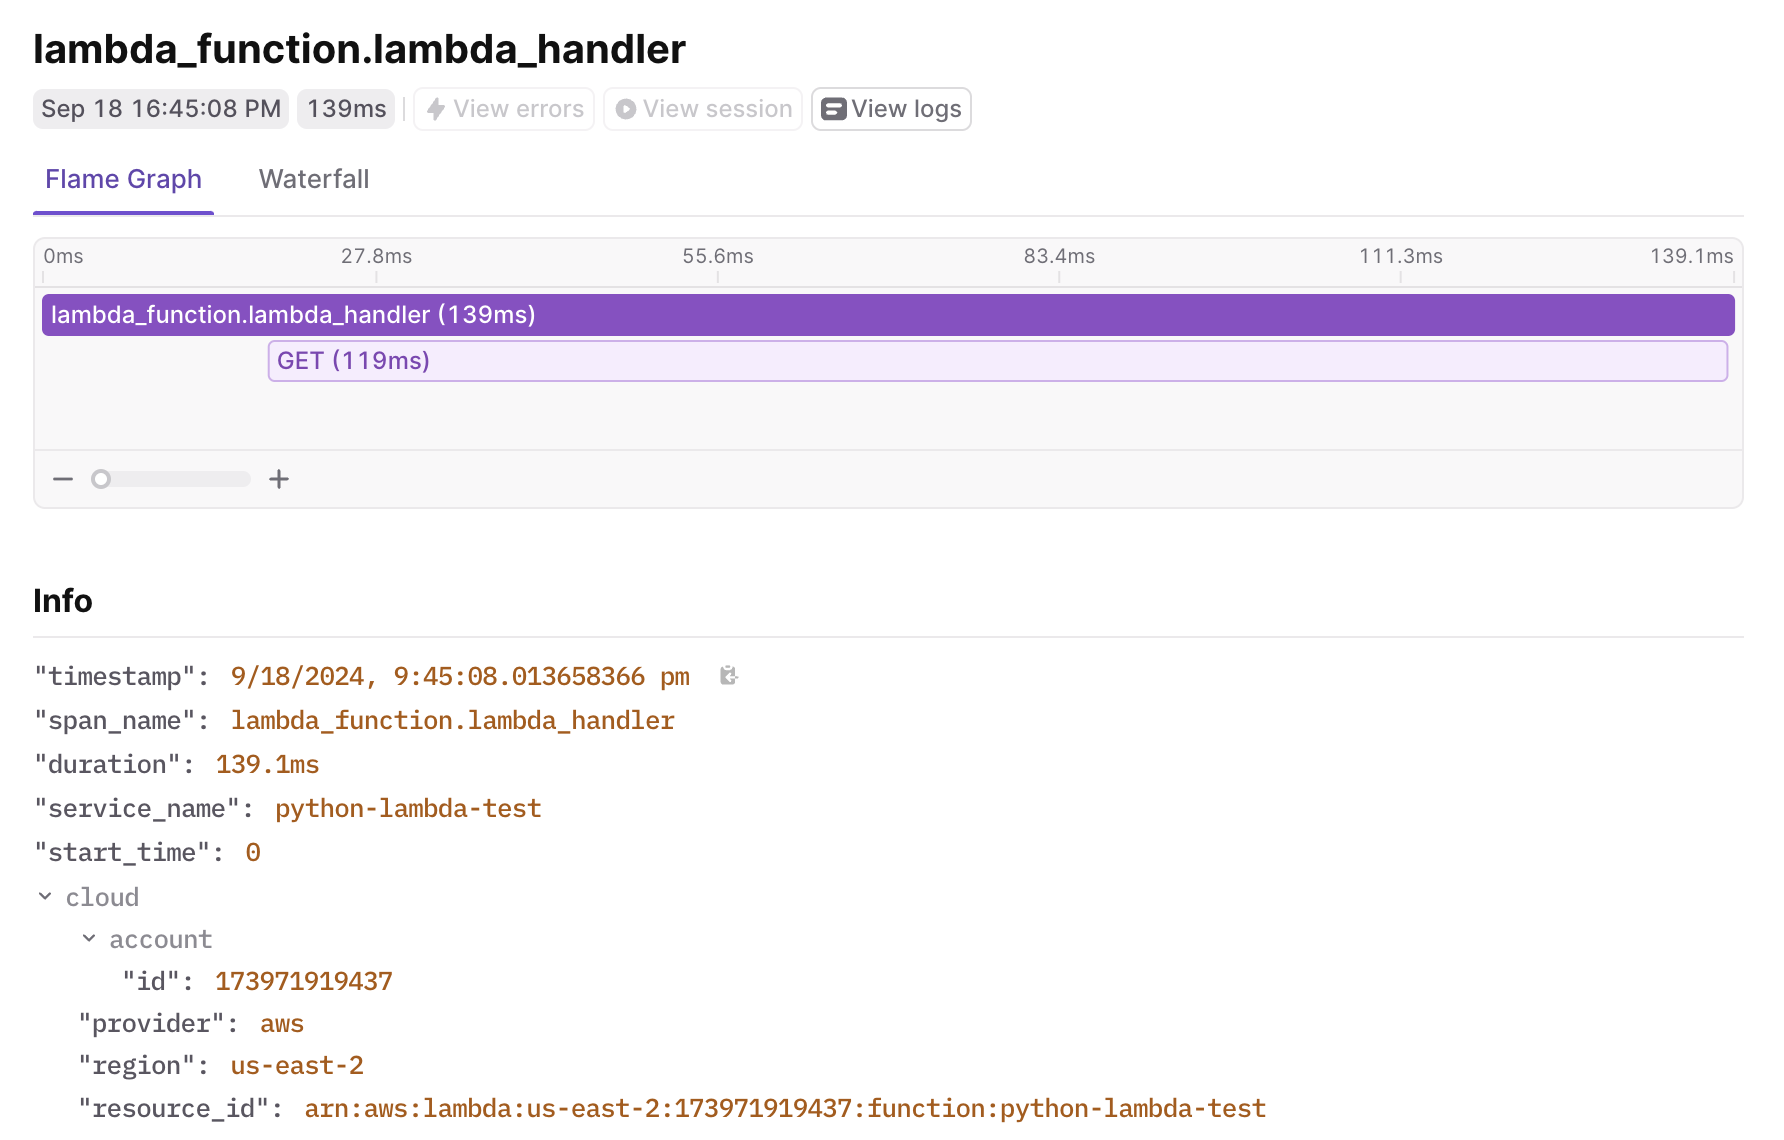
Verify your backend traces are being recorded.
Visit the highlight traces portal and check that backend traces are coming in. 
Install the highlight-io python package.
Download the package from pypi and save it to your requirements. If you use a zip or s3 file upload to publish your function, you will want to make sure highlight-io is part of the build.
poetry add highlight-io# or with pip
pip install highlight-ioInitialize the Highlight SDK.
Setup the SDK. Add the @observe_handler decorator to your lambdas.
import highlight_io
from highlight_io.integrations.aws import observe_handler

# `instrument_logging=True` sets up logging instrumentation.
# if you do not want to send logs or are using `loguru`, pass `instrument_logging=False`
H = highlight_io.H(
	"<YOUR_PROJECT_ID>",
	instrument_logging=True,
	service_name="my-app",
	service_version="git-sha",
	environment="production",
)


@observe_handler
def lambda_handler(event, context):
    return {
        "statusCode": 200,
        "body": f"Hello, {name}. This HTTP triggered function executed successfully.",
    }
Verify your installation.
Check that your installation is valid by throwing an error. Add an operation that raises an exception to your lambda handler. Setup an HTTP trigger and visit your lambda on the internet. You should see a DivideByZero error in the Highlight errors page within a few moments.
import highlight_io
from highlight_io.integrations.aws import observe_handler

# `instrument_logging=True` sets up logging instrumentation.
# if you do not want to send logs or are using `loguru`, pass `instrument_logging=False`
H = highlight_io.H(
	"<YOUR_PROJECT_ID>",
	instrument_logging=True,
	service_name="my-app",
	service_version="git-sha",
	environment="production",
)


@observe_handler
def lambda_handler(event, context):
    return {
        "body": f"Returning this is a bad idea: {5 / 0}.",
}Verify your backend logs are being recorded.
Visit the highlight logs portal and check that backend logs are coming in.
Verify your backend traces are being recorded.
Visit the highlight traces portal and check that backend traces are coming in.