
Metrics in AWS
Monitoring AWS Infrastructure Metrics
Highlight makes it simple to monitor your AWS infrastructure metrics. You can easily set up monitoring for services like EC2, Lambda, RDS, and more with just a few clicks using our CloudFormation template.
Quick Setup Using CloudFormation
Navigate to the configuration page in your project, select your AWS region where your infrastructure is deployed, and click the "Deploy CloudFormation Stack" button to launch the template in your AWS account.

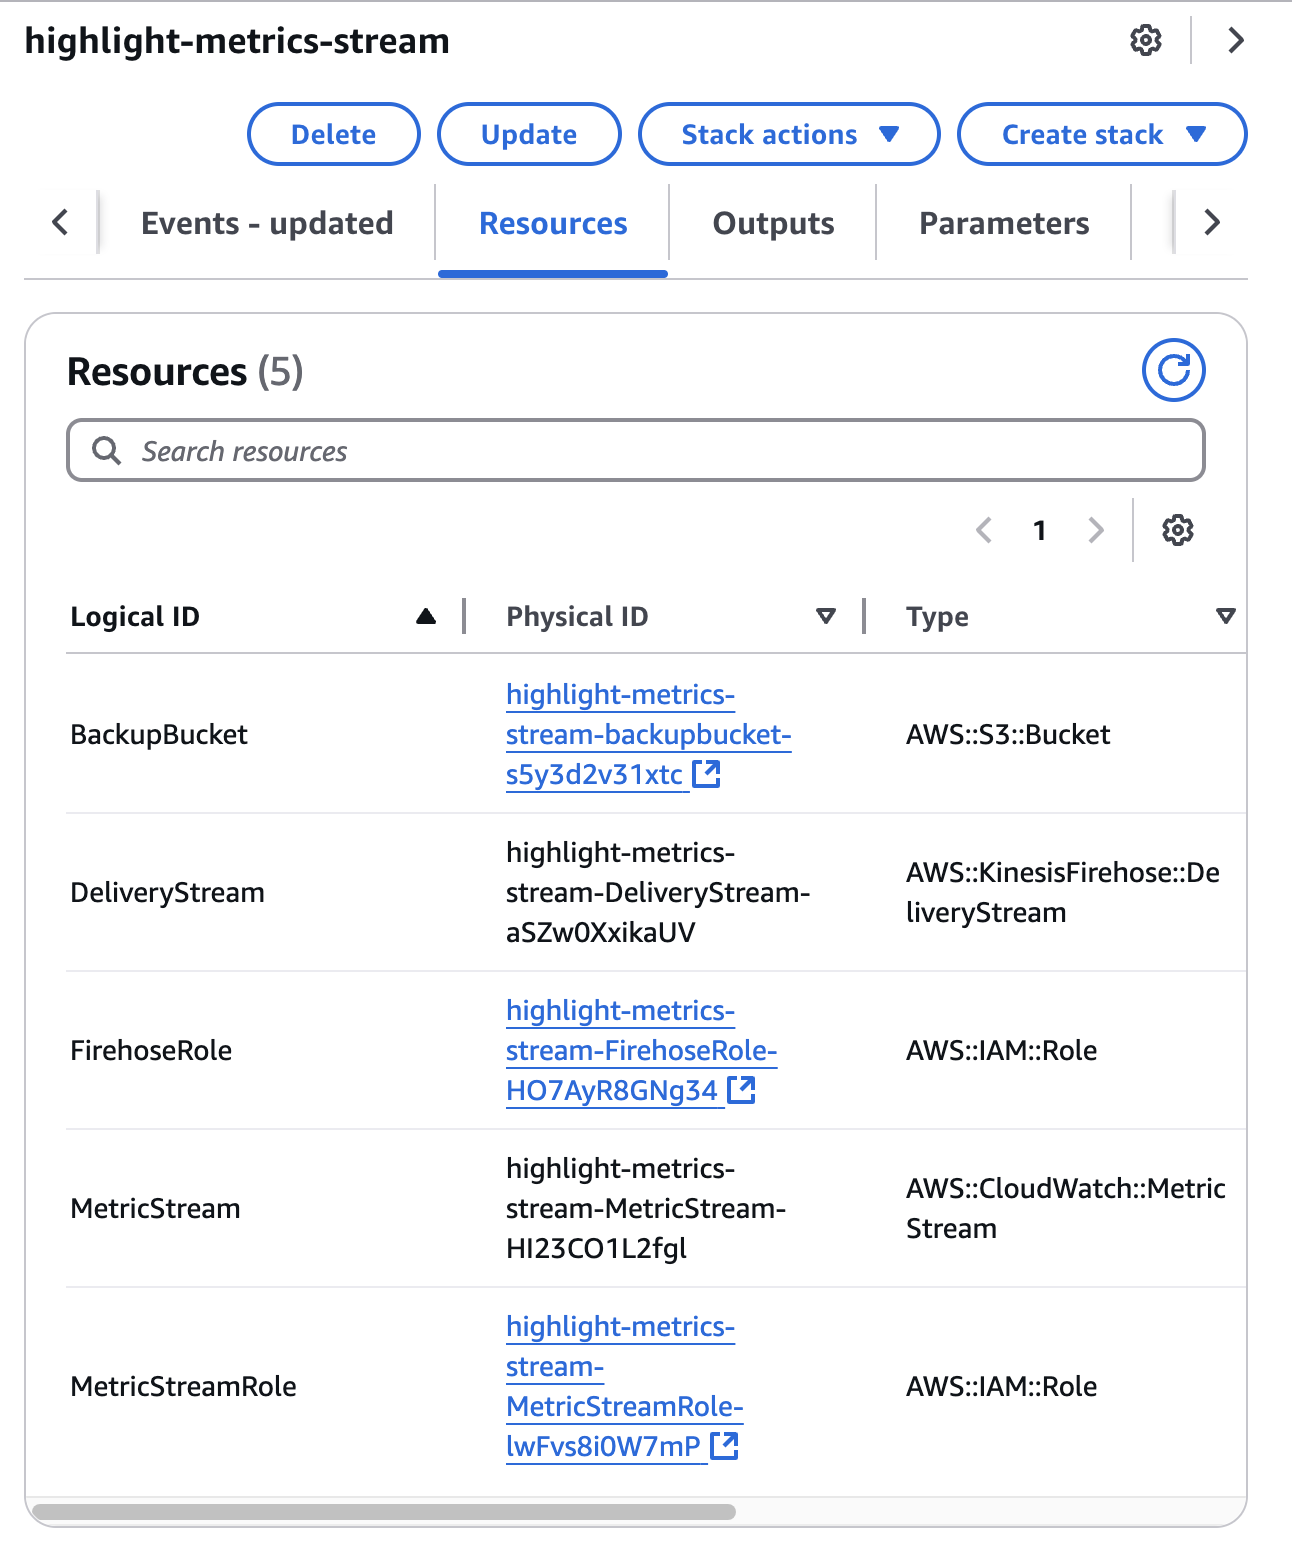
Review the template settings in the AWS CloudFormation console and create the stack. You'll need to wait a few minutes for the resources to be provisioned.

All resources are isolated in a CloudFormation Stack, making it easy to manage and remove if needed.
What Gets Monitored
By default, the metric stream will export all available CloudWatch metrics from your account. This includes metrics from services like:
- EC2 (CPU, memory, disk usage)
- Lambda (invocations, errors, duration)
- RDS (database connections, CPU, storage)
- And many more AWS services
You can customize which metrics are exported by editing the metric stream in the AWS console.

Viewing Your Metrics
Once the stack is deployed, metrics will begin flowing into Highlight within a few minutes. You can:
- Create custom dashboards to visualize your infrastructure metrics
- Set up alerts based on metric thresholds
- Correlate infrastructure metrics with your application logs and traces
Manual Setup
If you prefer to set up the integration manually or need more customization, you can do so by following these steps:
- Create a CloudWatch Metric Stream
- Create a Kinesis Firehose
AWS Kinesis Firehose with CloudWatch Metric Streams for infrastructure metrics
This is a manual guide for setting up metrics export if you prefer to do it manually. However, there are some benefits of using the CloudFormation template and isolating the resources in a CloudFormation stack.
First, create a Direct PUT Source Firehose stream with an HTTP Endpoint destination.
Configure your Firehose stream to ship metrics to our OpenTelemetry 1.0 Firehose metrics format ingest endpoint https://otlpv1.firehose.highlight.io, enabling GZIP content encoding and passing paramater x-highlight-project with your highlight project ID.


Next, create a CloudWatch Metric Stream to send metrics to the Firehose stream. Select OpenTelemetry 1.0 as the data format and select the stream you created. You can filter the metrics to only include the ones you want to monitor.

Your metrics will now be streaming to the highlight OpenTelemetry collector and ingested into your project. You can view your metrics in the highlight.io UI and start creating dashboards and alerts based on them.
Supported Data Formats
The above assumes the OpenTelemetry 1.0 format will be used, but we support the following data formats:
- OpenTelemetry 1.0: https://otlpv1.firehose.highlight.io
- JSON: https://cwmetrics.firehose.highlight.io
Need Help?
If you have any questions about setting up AWS metrics monitoring, don't hesitate to reach out to our community!